| Mars Close Approaches | |
|
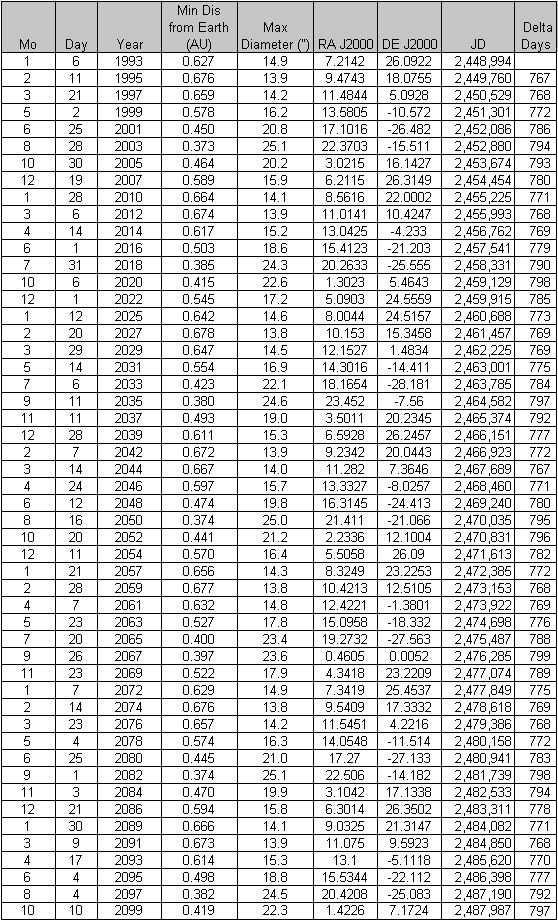
This table
list all of the close approaches for the next 100 years. If the predictions
are a little off, it's because the calculations were made a long time ago
on my Apple //e. The table lists the month, day, and
year for the close approach. The minimum distance to Earth
is shown in astronomical units and the maximum diameter is shown in arc
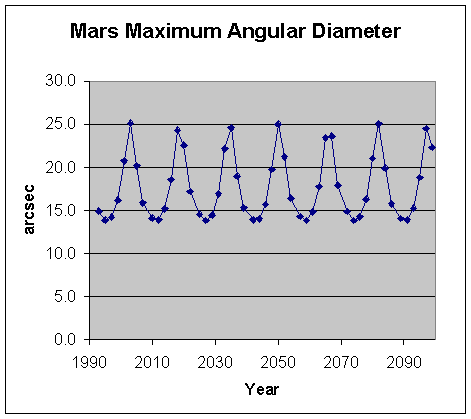
sec. There is a graph below the table that plots this parameter
over time. This is the important parameter for viewing, because the
larger this number is, the larger Mars appears in the telescope.
Note that the next three close approaches will be very good.
The next two
columns shown are right ascension and declination in J2000 coordinates.
The format for right ascension is hh.mmss and the format for declination
is dd.mmss. JD is the Julian Date corresponding to the month day
and year and Delta days is the number of days since the last close approach.
For the years 1993-2099 the average of this number is 779.9 days.
The first graph shows
that peaks occur in the maximum diameter about every 15 years.
So if you miss the next three close approaches, you'll have to wait about
15 years for another set to occur.
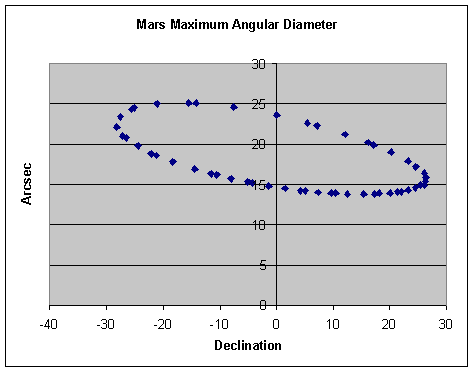
The second graph shows why you need to move to the southern hemisphere. Note that all of the really really good viewing opportunities (diameter around 25 arc sec) occur when Mars is at a southern declination. So why does the maximum viewing diameter change? Well, the orbits are elliptical and not circular. So the distance between the planets and the Sun is always changing. Sometimes the Earth goes past Mars when Mars is near the Sun and the Earth is far from the Sun. Under these conditions the Earth is as far out as it can get and Mars is as close in as it can get, so the minimum distance between them is as close as it can get. Other times, the opposite happens and the minimum distance between them is as far as it can get. Most of the time it is somewhere in between. |
|
 |
Click
here to download the table |


